
Quick Start Guide
This getting started guide will teach you how to use LiveDataFrame. LiveDataFrame uses Python, Pandas, and Jupyter Notebooks to enable robust data analysis on live cryptocurrency market feeds. Although this is a complex topic, we aim to make this as painless as possible for you.
If you are having any troubles following along, you can brush up on your Python data analysis skills at any time with this comprehensive tutorial.
In this guide, you will learn to:
- Sign up for LiveDataFrame and get your Free API Key
- Set up your environment to analyze crypto coin-pairs
- Start your first LiveDataFrame
- View live market data
- Create live charts
Sign up for LiveDataFrame
Signup is now closed for LiveDataFrame.
When you have your keys, you can start setting up your Python environment!
Set up environment
What do we need?
Install python 3
LiveDataFrame is built with Python. It is easy to learn, but very powerful. Because it is so popular, you will find lots of resources on quantitative trading, data analysis, and even machine learning with Python.
LiveDataFrame has been built for Python 3. If you’re using MacOS or Linux, you probably already have Python 3 installed. You can check this by opening up a terminal (ctrl+t on linux, cmd+space then type terminal on mac) and running the following command:
which python3
If the response is python3 not found, then you will have to install it. You can refer to Python's official documentation here, or follow along below for your machine.
Mac
Install Python 3 here and follow the instructions.
Linux
Install Python 3 through the terminal:
sudo apt-get update
sudo apt-get install python3.6
Windows
We recommend setting up your environment with Anaconda. It includes 250+ popular data science packages and the conda package and virtual environment manager. Anaconda comes ready to go with Python, Pandas, and Jupyter Notebooks.
Update Pip3
pip3 install --upgrade pip
Install Jupyter Notebook for running LiveDataFrame (HIGHLY RECOMMENDED)
The Jupyter Notebook will become your strategy prototyping workhorse. It allows you to create and share documents that contain live code, equations, and visualizations.
pip3 install jupyter
Install LiveDataFrame
The LiveDataFrame client is what connects your environment to market data. The live market data is formatted specifically for LiveDataFrame and streamed to your computer for immediate analysis.
You can install it through pip by running the following command in terminal:
pip3 install livedataframe
You can upgrade the client through pip as well by running the following command:
pip3 install livedataframe --upgrade --no-cache-dir
Start your first LiveDataFrame
Initializing
from livedataframe import LiveExchange

livedf_bittrex = LiveExchange(
    public_key='REPLACE-WITH-YOUR-PUBLIC-KEY',
    secret_key='REPLACE-WITH-YOUR-SECRET-KEY',
    exchange = 'bittrex',
    symbols = ['BTC-ETH', 'BTC-XRP'],
    lookback_period = '1H'
)
Now that we have your environment set up, we can create LiveDataFrames for two coin pairs on Bitfinex: BTC-ETH and BTC-XRP.
Open a new terminal tab and type:
jupyter-notebook
This will open a tab in your browser. In that tab click New from the top right and then Python 3 Notebook.
Call it livedataframe_intro.ipynb by clicking 'Untitled' at the top of the page. Type or paste in this code sample. You will have to make a few changes to get it to work, so follow along.
Replace the placeholder public and secret keys
Remember the Public and Secret keys you were emailed earlier? Those are used to authenticate you when you start a LiveDataFrame. Replace public_key and secret_key with the keys that were emailed to you when you signed up.
Exchange Value
You have access to the Bittrex, Bitfinex, and Binance exchanges during beta.
In this example we have requested a LiveDataFrame for Bittrex.
Symbols Value
There are a two ways to specify which coins you would like to analyze.
| Value | Description |
|---|---|
'ALL' String |
You will get all 282 coins available on Bittrex |
['BTC-ETH', 'BTC-XRP'] List of Strings |
If you provide a python list of coin-pairs, you will only get those returned |
In this example we have requested Ethereum (BTC base) and Ripple (BTC base) by specifying symbols = ['BTC-ETH', 'BTC-XRP']
Select a lookback period
A streaming cryptocurrency feed is awesome on its own. However, it is often useful to see how the present compares with the past. We allow you to view the current live OHLCV data, as well as past OHLCV data. Check out our detailed documentation to see what options you have.
For now, lets stick to '1H' where 1 is the number of Hours
Note: The maximum lookback period is 4H for the beta period.
Start it up!
Starting the LiveDataFrame
livedf_bittrex.start()
With everything initialized, use the start() method.
It will take a few moments to load historical data. If all goes well, you will get a message that says TOTAL TIME TO LOAD: <some time>.
The next section will show you what you can do with it.
View live market data
Once started, the client will constantly be updated with new OHLCV values for the coins you've selected. In the client, each coin's dataframe is stored in a dictionary. Use the marketname (how the coin is listed on the exchange) as your key to access the dataframe inside this dictionary.
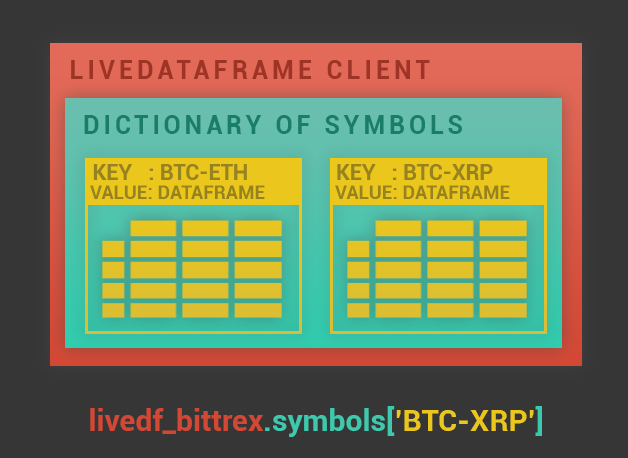
Accessing a coin-pair
Access the LiveDataFrame for 'BTC-ETH'
livedf_bittrex.symbols['BTC-ETH']
In the last section, we initialized LiveDataFrame to stream the coin-pairs BTC-ETH
and BTC-XRP from bitfinex. Now we want to observe a coin.
Use the code snippet on the right to access 'BTC-ETH'.
If you have forgotten which coins you subscribed to, you can always use
livedf_bittrex.list_symbols() or livedf_bittrex.symbols.keys() to see them.
Most recent data for one coin
View the most recent update for a coin
livedf_bittrex.symbols['BTC-ETH'].tail(1)
LiveDataFrame is always refreshing at 5 second intervals in the background.
Using Pandas' tail method, lets view the most recent update. Enter the code snippet on the right into a new jupyter cell. Take note of the timestamp.
Wait 5 - 10 seconds and enter livedf_bittrex.symbols['BTC-ETH'].tail(1) again (press SHIFT+ENTER to run a cell). You
will see that the timestamp is different, and you are now viewing the most recent
OHLCV update. (Keep retrying until you see it change!)
If you have not used Pandas DataFrames before, now is the time to learn about them. You can look through the very well written docs or take a quick 10 minutes to learn the basics.
Most recent data for many coins
Comparing last price between BTC-ETH and ETHBTC
# For every coin we've subscribed to inside our dictionary...
for coin in livedf_bittrex.list_symbols():
    # We are using iloc instead of tail to get a VALUE.

    # Take the VALUE of the timestamp from the COLUMN 'TimeStamp'
    timestamp = livedf_bittrex.symbols[coin]['TimeStamp'].iloc[-1]
    # Take the VALUE of the last price from the COLUMN 'Last'
    last_price = livedf_bittrex.symbols[coin]['Last'].iloc[-1]

    # Print the 'coin' name, the 'timestamp', and 'last_price'
    print('{coin} - TimeStamp: {timestamp} - Last Price: {last_price}'.format(coin=coin,
                                                                              timestamp=timestamp,
                                                                              last_price=last_price))
To compare many coins together, simply iterate through the dictionary and perform an operation on each coin's dataframe. Enter the code to the right in a new cell. You should see an output like this:
BTC-ETH - TimeStamp: 2018-06-01T19:59:50.037 - Last Price: 0.07709199
`BTC-XRP - TimeStamp: 2018-06-01T19:59:49.663 - Last Price: 8.208e-05
If you run the cell again in 5 - 10 seconds, the data will be up to date!
Wait, there's more!
Wait, there's more!
from IPython.display import display, clear_output
import time

# Use a while loop to repeat operations as new data comes in.
while True:

    # Same as before..
    for coin in livedf_bittrex.list_symbols():
        timestamp = livedf_bittrex.symbols[coin]['TimeStamp'].iloc[-1]
        last_price = livedf_bittrex.symbols[coin]['Last'].iloc[-1]

        print('{coin} - TimeStamp: {timestamp} - Last Price: {last_price}'.format(coin=coin,
                                                                                  timestamp=timestamp,
                                                                                  last_price=last_price))

    # Wait 5 seconds for the next update
    time.sleep(5)
    # Clear the screen so it can be updated with new information
    clear_output(wait=True)
Wouldn't it be cool if you didn't have to press enter on a jupyter cell to see the latest price? This is definitely possible. Try out the code snippet to the right. You should see an output like this:

Whats going on here?
Just like before, we used a for loop to perform an operation on each coin's dataframe. However, this time we wrapped these operations in a while loop to perform them continually.
Every five seconds (time.sleep(5)) we run the operations, clear our output,
and replace it with the updated prices. This will become a familiar pattern when
interacting with LiveDataFrame.
Jupyter Notebooks lets you clear the output using the clear_output method from
the IPython.display library. Jupyter has many cool tricks like this.
Create live charts
We're going to start this section by immediately jumping into code. We will be plotting
the last price of BTC-ETH.
Chart one coin
Static Plot - One Coin
%matplotlib inline
livedf_bittrex.symbols['BTC-ETH']['Last'].resample('5T', label='right').last().plot()
Enter the code to the right into a new jupyter cell and press enter. You should see a plot of BTC-ETH in your Jupyter Notebook. Lets walk through what we just did.
- First, we picked a coin to analyze from our subscribed coins in LiveDataFrame:
livedf_bittrex.symbols['BTC-ETH']
- This time we only wanted the column
Lastbecause we are interested in charting the price:
livedf_bittrex.symbols['BTC-ETH'] ['Last']
- Because new data comes in every 5 seconds, it could take quite a bit of resources to plot every single data point. Let's resample our data to one data point every 5 minutes (a 5 minute bar):
livedf_bittrex.symbols['BTC-ETH']['Last'].resample('5T', label='right')
- In a 5 minute period there are (60 seconds / 5 second intervals) * 5 minutes = 60 data points.
When we resample, we want to pick which one of those data points to use. Most of the time you will be interested in the closing price at the END of the 5 minute bar. So lets use the last price.
livedf_bittrex.symbols['BTC-ETH']['Last'].resample('5T', label='right').last()
- Finally, we use Pandas' plot method to create a plot:
livedf_bittrex.symbols['BTC-ETH']['Last'].resample('5T', label='right').last().plot()
As you can see, quite a lot can be accomplished in one line of code
Chart many coins
Naive Static Plot - Many Coins
%matplotlib inline

for coin in livedf_bittrex.symbols.keys():
    livedf_bittrex.symbols[coin]['Last'].resample('5T', label='right').last().plot()
Just like before, we use a for loop to iterate through our coins and perform our plotting operation. Enter the code on the right into a new Jupyter Cell. Did you notice anything strange?
The problem with comparing coins:
At the time of writing, BTC-ETH was trading for 0.077 Bitcoins, and BTC-XRP for 0.000082 Bitcoins. Because of the huge difference in value per coin, it is difficult to compare price directly. (The y-axis simply can't handle it!)
A better way to do it
Better Static Plot - Many Coins
%matplotlib inline
import numpy as np

for coin in livedf_bittrex.symbols.keys():
    # Store our resampled 'Last' prices
    resampled_coin = livedf_bittrex.symbols[coin]['Last'].resample('5T', label='right').last()
    # Get the log returns of a coin
    log_returns_of_coin = np.log(resampled_coin / resampled_coin.shift(1))
    # Take the series cumulative sum, negate the log operation with np.exp, plot it.
    log_returns_of_coin.cumsum().apply(np.exp).plot()
An easier way to compare coins is by comparing log returns of a coin. So lets go ahead and do that with the code to the right.
We utilized the log and exp operations that Numpy provides for fast calculations.
Wait, there's more!
Wait, there's more!
%matplotlib inline
from IPython.display import display, clear_output
# Pandas uses matplotlib as it's plotting backbone.
# We are going to need it this time to hold and show plots:
import matplotlib.pyplot as plt
import time
import numpy as np

# Use a while loop to repeat operations as new data comes in.
while True:

    for coin in livedf_bittrex.symbols.keys():
        # This time resample one minute bars, and look at only the LAST 30 minutes with the TAIL method
        resampled_coin = livedf_bittrex.symbols[coin]['Last'].resample('T', label='right').last().tail(30)
        # Get the log returns of a coin
        rate_of_change_of_price = np.log(resampled_coin / resampled_coin.shift(1))
        # Take the series cumulative sum, negate the log operation with np.exp, plot it.
        rate_of_change_of_price.cumsum().apply(np.exp).plot(figsize=(10, 6))

    # This time we use plt.show() to show all of our plots after we perform our for loop operations.
    plt.show()
    # Wait 5 seconds for the next update
    time.sleep(5)
    # Clear our screen so we can update it with new information
    clear_output(wait=True)
Wouldn't it be cool if you didn't have to press enter on a jupyter cell to update your plot? This is definitely possible. Try out the code snippet to the right. You should see the plot updating in realtime.
Pretty cool, huh?
API Reference
ExchangeInfo
We provide a helper class to see which exchanges and coin pairs are offered.
Import
from livedataframe import ExchangeInfo
Exchanges available
Exchanges available
from livedataframe import ExchangeInfo

ExchangeInfo.list_exchanges()
Parameters
None
Returns
List of exchanges available:
['bittrex', ... , 'bitfinex']
Symbols available
Symbols available
from livedataframe import ExchangeInfo

ExchangeInfo.list_symbols_for(exchange)
Parameters
| Parameter | Type | Description |
|---|---|---|
| exchange | string | Lowercase exchange name of requested symbols |
Returns
List of coin pairs available for specified exchange:
['BTC-ETH', ... , 'BTC-XRP']
LiveExchange
LiveExchange is your interface to LiveDataFrame. One LiveDataFrame will be created for each of the symbols that you subscribe to. Once started, The client will constantly be updated with new OHLCV values for the coins you've selected. In the client, each coin's dataframe is stored in a master dictionary, named 'symbols.'
Import
from livedataframe import LiveExchange
Initializing
Syntax
from livedataframe import LiveExchange

livedf_bittrex = LiveExchange(
    public_key='REPLACE-WITH-YOUR-PUBLIC-KEY',
    secret_key='REPLACE-WITH-YOUR-SECRET-KEY',
    exchange = 'bittrex',
    symbols = ['BTC-ETH'],
    lookback_period = '1H',
    timezone = 'US/Eastern'
)
Parameters
| Parameter | Type | Description |
|---|---|---|
| public_key | string | Required. Public key emailed to you during sign up. |
| secret_key | string | Required. Secret key emailed to you during sign up. |
| exchange | string | Required. Lowercase name of requested exchange. Note: Only specify one exchange. |
| symbols | list of symbols OR the string "ALL" | Required. List of symbols that you want to start LiveDataFrames for. "ALL" starts a LiveDataFrame for every symbols available on exchange specific. |
| lookback_period | string | Required. Valid duration identifiers: 'S' = second, 'T' = minute, 'M' = minute, 'H' = hour. Example: 5T will return 5 minutes of historical values per LiveDataFrame. Note: The Maximum lookback period is capped at 4H for the Beta period. |
| timezone | string | Optional. If you want the timeformat to be returned in a specified format, use any value from here. For example: 'US/Eastern' or 'Portugal'. If not specified, then it defaults to UTC time. |
Returns
Initialized LiveExchange object, ready to start.
Start
Start Example
livedf_bittrex.start()
Starts LiveDataFrame.
Parameters
None.
Result
Queries for historical data and then starts the websocket conneciton for LiveDataFrames. Client starts receiving OHLCV values.
Stop
Stop Example
livedf_bittrex.stop()
Stops the 'live' portion of the LiveDataFrame.
Parameters
None.
Result
LiveDataFrame stops updating with the market. All static data received up until this point is still accessable. Once stopped, the dataframe must be re-started via .start(). However, there will be a delay as data will have to be requeried.
Stream Status
Stream Status Example
livedf_bittrex.stream_status()
Returns the current status of the LiveDataFrame.
Parameters
None.
Returns
| Result | Meaning |
|---|---|
DISCONNECTED - NOT RETRYING |
No new market data will be streamed. LiveDataFrame is not attempting to reconnect. LiveDataFrame goes into this state when .stop() is called. |
DISCONNECTED - RETRYING |
No new market data is being streamed. LiveDataFrame is attempting to reconnect. LiveDataFrame goes into this state when there is a network issue. |
CONNECTED |
New market data is streaming. LiveDataFrame goes into this state when .start() is called and a successful connection has been made with the LiveDataFrame API. |
Access symbol
Accessing Symbol Example
livedf_bittrex.symbols['BTC-ETH']
Returns the most up to date LiveDataFrame for a symbol.
Parameters
| Parameter | Type | Description |
|---|---|---|
| symbol_key | string | Required. The symbol whose LiveDataFrame you want to access. |
Returns
The most up to date LiveDataFrame for the symbol requested.
Exchange Data Provided
Bittrex
Streaming Coins Available
Every coin trading on Bittrex is available to stream with LiveDataFrame.
To see a list of the 288+ available, check out CoinMarketCap.
Data Provided
The LiveDataFrame will update coins every 5 seconds, and return the following data:
| Value | Description |
|---|---|
| MarketName | The name of the coin, as listed on exchange. MINOR-MAJOR |
| Last | Price of the latest trade. |
| Bid | Maximum price that a seller is willing to receive. |
| Ask | Maximum price that a buyer is willing to pay. |
| OpenBuyOrders | Amount of outstanding buy orders. |
| OpenSellorders | Amount of outstanding sell orders. |
| High | Highest price a coin traded over last 24H. |
| Low | Lowest price a coin traded over last 24H. |
| PrevDay | The price a coin traded for 24H ago. |
| TimeStamp | The time at which the update took place. |
| Volume | Amount traded in the major currency over the last 24h. |
| BaseVolume | Amount traded in the minor currency over the last 24h. |
| Created | The date this symbol was listed on exchange. |
Bitfinex
Streaming Coins Available
Every coin trading on Bitfinex is available to stream with LiveDataFrame.
To see a list of the 288+ available, check out CoinMarketCap.
Data Provided
The LiveDataFrame will update coins every 5 seconds, and return the following data:
| Value | Description |
|---|---|
| symbol | The name of the coin, as listed on exchange. MAJORMINOR |
| last_price | Price of the latest trade. |
| bid | Maximum price that a seller is willing to receive. |
| ask | Maximum price that a buyer is willing to pay. |
| ask_size | Size of the last lowest ask. |
| bid_size | Size of the last highest bid. |
| high | Highest price a coin traded over last 24H. |
| low | Lowest price a coin traded over last 24H. |
| daily_change | Amount that the price changed from 24H ago. |
| daily_change_perc | Amount that the price changed from 24H ago as a percent. |
| volume | Amount traded in the major currency over the last 24h. |
Binance
Streaming Coins Available
Every coin trading on Binance is available to stream with LiveDataFrame.
To see a list of the 338+ available, check out CoinMarketCap.
Data Provided
The LiveDataFrame will update coins every 5 seconds, and return the following data:
| Value | Description |
|---|---|
| symbol | The name of the coin, as listed on exchange. MAJORMINOR |
| close | Price of the latest trade. |
| last_price | Price of the latest trade. |
| last_trade_qty | Size of the latest trade. |
| bid_price | Maximum price that a seller is willing to receive. |
| ask_price | Maximum price that a buyer is willing to pay. |
| ask_qty | Size of the last lowest ask. |
| bid_qty | Size of the last highest bid. |
| open | The price a coin traded for 24H ago. |
| high | Highest price a coin traded over last 24H. |
| low | Lowest price a coin traded over last 24H. |
| prev_day_close_price | Previous day's close price |
| price_change | Amount that the price changed from 24H ago. |
| price_change_pct | Amount that the price changed from 24H ago as a percent. |
| volume | Amount traded in the minor currency over the last 24h. Note that Binance labels their base volume different from Bittrex. |
| base_volume | Amount traded in the major currency over the last 24h. Note that Binance labels their base volume different from Bittrex. |
| weighted_avg_price | The average price at which the coin is traded over 24H. |
Tutorials
Arbitrage Detector for Crypto Currencies
Create an augmented trading tool that will find, and alert you to, arbitrage opportunities across all assets on 2 different exchanges.
Click here to get the Jupyter Notebook
Volume Analysis for Pump Detection
Create a customizable alerting tool to monitor volume changes accross all coins using LiveDataFrame.
Click here to get the Jupyter Notebook
Realtime Indicators
This tutorial will show you how to add live indicators to cryptocurrency market data.